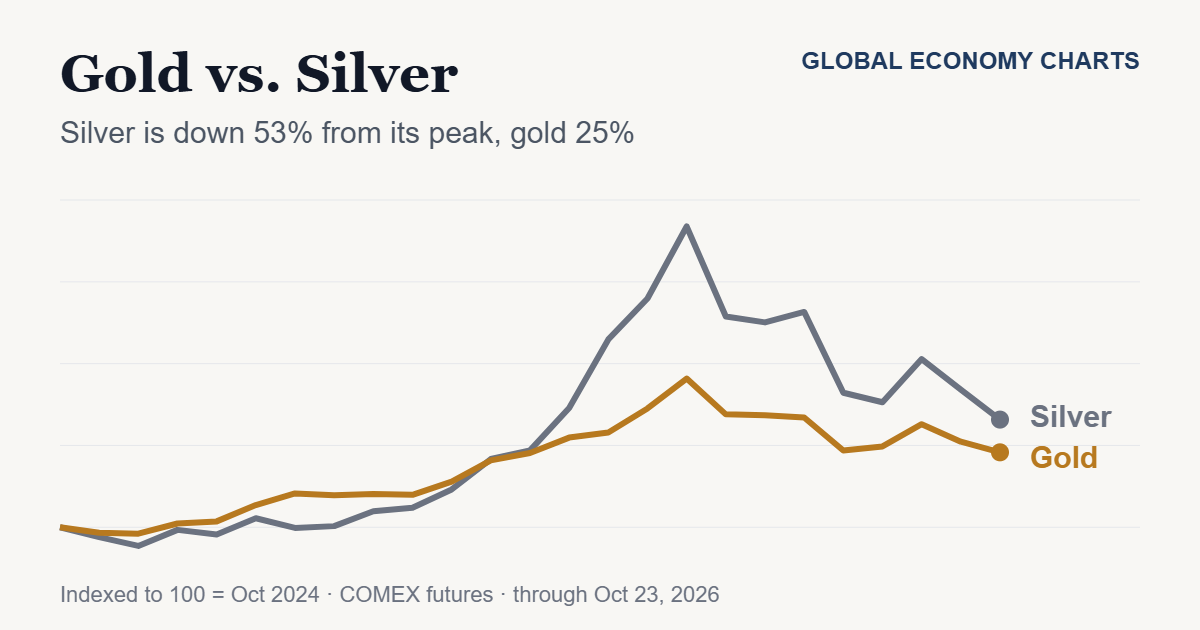
Gold is about 25% below its January peak, while silver has fallen about 53%, more than twice as far.
Oct 24, 2026 · Global Economy Charts · Market analysis
1. The numbers behind the headline
| Metric | Gold (USD/oz) | Silver (USD/oz) |
| Latest close (Oct 23) | 4,009 | 54.14 |
| Peak close (Jan 2026) | 5,318 (Jan 29) | 115.08 (Jan 26) |
| Decline from peak | -24.6% | -53.0% |
| Change over 12 months | +0.3% | +12.8% |
| Change since Oct 2024 | +45.8% | +65.8% |
Gold and silver both climbed through 2025 and into January 2026, then gave back a large part of the move. Over two years, both metals are still higher: gold by about 46% and silver by about 66%.
GEC Deep Dive: What the Headlines Miss
Silver moves further in both directions
Rebasing both metals to 100 in October 2024 shows the pattern clearly. Gold rose steadily and reached an index level of about 191 at the end of February 2026. Silver accelerated faster in late 2025 and reached about 284 in the same month, which means it had nearly tripled in 16 months.
The decline followed the same shape in reverse. From the February month-end, gold has fallen about 24% and silver about 42%. Silver is a smaller and more volatile market than gold, so larger swings in both directions are consistent with this history. The data here show the size of the moves, not their cause.
What the gold-to-silver ratio shows
The ratio divides the gold price by the silver price, so it measures how many ounces of silver one ounce of gold buys. It was about 84 in October 2024 and rose above 100 in April 2025, when silver was cheap relative to gold. It then fell to 56.6 in February 2026 as silver outran gold, and has since recovered to about 74 as silver gave back more of its gains.
What to watch next
- The $4,000 area for gold. The latest close sits just above it, and the next monthly close will show whether it holds.
- The ratio. A move back toward 80 would mean silver is again lagging gold, while a move toward 60 would mean silver is leading.
- Volatility. Silver’s drawdown has been about twice gold’s, so position sizing matters more than direction calls for anyone following both.
Data and method
Prices are month-end closes of front-month COMEX gold (GC=F) and silver (SI=F) futures from Yahoo Finance, with the final point taken on October 23, 2026. Futures prices can differ slightly from spot prices quoted elsewhere, including the live TradingView widgets on this site. Percentage changes are calculated from the closing prices shown. Peak figures use daily closes.
This article is for informational purposes only and is not investment advice.
Leave a Reply