Global Economy Charts | Market Psychology, Financial History & Precious Metals | October 9, 2026

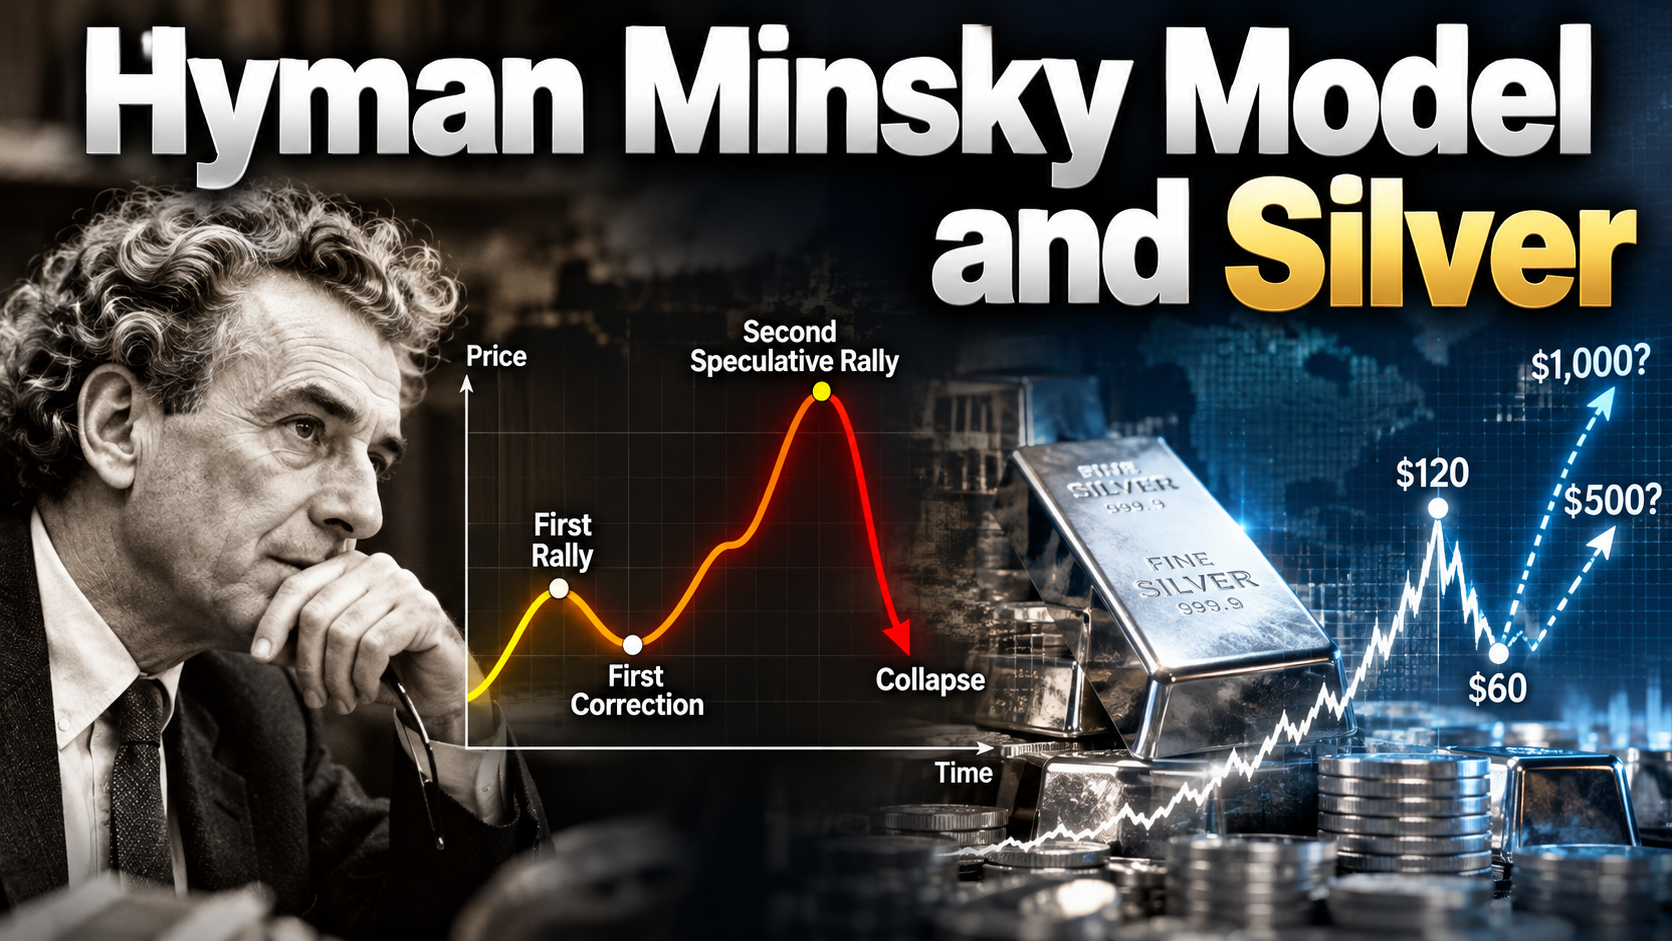
After silver’s extraordinary breakout above a 45-year price barrier, the metal surged to approximately $120 an ounce—then collapsed toward $60. Is the historic rally already over, or could the market be experiencing the first major correction of a much larger speculative cycle?
Financial markets have a remarkable habit of convincing investors that the future is obvious—right before proving them wrong.
During a powerful rally, investors begin to believe that prices can only move higher. During a violent correction, those same investors often become convinced that the opportunity has disappeared forever.
But history shows that some of the most spectacular speculative advances have not occurred in a single uninterrupted movement.
Instead, they have developed through two distinct waves.
First comes a dramatic rally, followed by a correction severe enough to shake investor confidence. Then, sometimes, a second and substantially larger advance takes prices beyond their previous highs.
Eventually, excessive optimism gives way to a devastating collapse.
This recurring pattern resembles the famous market-bubble psychology chart commonly associated with economist Hyman Minsky.
And today, silver presents an intriguing question.
After spending roughly 45 years below its historic nominal highs near $50, silver broke out in 2025 and reached approximately $121.62 on January 29, 2026. By early October, it was trading around $60—roughly half its peak value
Was that the entire speculative cycle?
Or could the first rally and the first major correction already be behind us, with a second wave still to come?
To explore that possibility, we must first understand Minsky’s theory—and then examine what actually happened in several extraordinary stock-market episodes.
1. Who Was Hyman Minsky, and What Did He Discover About Financial Markets?

In Minsky’s framework, stability can gradually create the conditions for instability.
When the economy is performing well, businesses and investors become more confident. Credit expands, risk-taking increases, and financial structures become progressively more dependent on continued favorable conditions.
Minsky distinguished three forms of financing:

During prolonged prosperity, financial activity can shift toward increasingly fragile arrangements.
When asset prices stop rising, borrowing becomes more expensive, or refinancing becomes difficult, that fragility can produce a self-reinforcing decline.
Minsky explained these mechanisms in his 1992 paper, The Financial Instability Hypothesis.
Levy Economics Institute of Bard College
His work is often summarized by a deceptively simple principle:
- Stability can breed instability.
The significance is profound.
A market can become more vulnerable precisely because investors have grown accustomed to favorable conditions.
The famous Minsky bubble chart

The diagram illustrates a sequence of changing investor expectations.
In the early stages, rising prices attract attention. A first rally develops, often supported by a genuine improvement in business conditions or a compelling investment narrative.
Then comes a correction.
Investors sell, confidence weakens, and the market appears to have exhausted its upward momentum.
Yet in some historical episodes, prices recover and enter a second, much larger rally.
The new advance attracts additional investors. Rising prices reinforce the belief that the original investment thesis was correct.
Optimism can become euphoria.
When expectations finally reverse, the decline may be even more dramatic than the preceding rise.
The crucial feature for our analysis is the first significant correction between two upward waves.
But the distinction matters: Minsky’s original work concerns financial structures, debt, leverage, and systemic fragility. The visual resemblance of a stock chart to a bubble diagram does not, by itself, prove that a market is experiencing a Minsky cycle.
With that qualification in mind, let’s examine four historical examples.
2. AMC Entertainment: The First Crash Before a Much Bigger Explosion
Case study 1 | AMC Entertainment (AMC) | January–June 2021 and aftermath

The 2021 meme-stock phenomenon produced one of the clearest examples of a speculative market experiencing two distinct waves.
In January 2021, shares of AMC Entertainment surged as retail traders coordinated around heavily discussed stocks.
AMC reached approximately $19.90 on January 27.
But the rally quickly reversed.
By May 13, shares had fallen to approximately $5.50, a decline of more than 70% from the January high.
At that point, the original speculative wave seemed to have faded.
Then the second wave arrived.
On June 2, 2021, AMC reached an intraday high of $72.62—more than three times its first peak.
The stock subsequently experienced severe declines as the meme-stock enthusiasm weakened.
AMC: Two Speculative Waves in 2021
Selected historical intraday milestones; USD per share, before subsequent corporate-action adjustments

Milestone plot, not a complete daily series. The post-2021 collapse is discussed in the text rather than charted with incompatible later share units.
AMC later underwent reverse splits and other equity actions. The 2021 figures shown here are historical prices on the original trading basis and should not be mixed directly with later split-adjusted prices.
The sequence is striking:
- First major speculative rally.
- A collapse of more than 70%.
- A second rally far above the previous high.
- A subsequent prolonged reversal.
The first correction did not prevent a larger second rally.
Indeed, the correction may have helped create the perception that the speculative episode was already finished.
AMC demonstrates why investors should be cautious about assuming that the first major decline necessarily marks the final end of a market frenzy.
But it also demonstrates how devastating the eventual reversal can become.
3. Carvana: A 58% Correction Before a Bigger Boom—and a 99% Collapse
Case study 2 | Carvana (CVNA) | 2017–2022

The history of Carvana provides a longer example of repeated speculative cycles.
After its 2017 public listing, Carvana became one of the market’s most closely watched online retail growth stories.
Investors were attracted to the idea that a technology-driven business could transform the traditional used-car industry.
The company’s shares rose sharply through 2018.
Then, between September and December 2018, Carvana experienced a drawdown of approximately 57.9%.
That was a substantial correction—not a minor fluctuation.
But the market recovered.
Carvana subsequently reached new highs, suffered another major correction during the March 2020 pandemic panic, and then entered an even more powerful rally.
The stock reached a major peak in August 2021.
By December 2022, however, the shares had fallen approximately 99% from that peak.

Carvana’s historical turning points
September–December 2018

Carvana is particularly useful because its first major correction was large enough to be unmistakable.
Yet it did not prevent a subsequent, much larger expansion.
At the same time, the company’s later recovery reminds us that financial-market cycles do not always end permanently after a spectacular collapse.
Carvana eventually recovered its previous peak in 2025.
The lesson is not that every crash leads to another rally.
It is that markets can experience multiple dramatic phases, and the meaning of a correction is often clear only in hindsight.
4. Novavax: A Vaccine Boom, a Sharp Correction, and a Higher Second Peak
Case study 3 | Novavax (NVAX) | 2020–2022
The COVID-19 pandemic created extraordinary opportunities and risks for biotechnology companies.
Among the most volatile was Novavax.
As investors anticipated demand for new vaccines, Novavax shares rose from less than $5 at the beginning of 2020 to more than $150 during the year.
The first major rally was followed by a substantial correction.
But the correction was not the end of the story.
In February 2021, Novavax reached a record closing price of approximately $319.93.
By the end of 2022, the stock had fallen to $10.28.
Novavax: First Rally, Correction, Higher Peak, Collapse
Selected historical closing-price observations and annual extrema, USD per share

The 2020 intermediate low is an approximate reference point; the 2021 high and 2022 close are documented. This is a milestone plot, not full daily history.
The annual 2020 high, February 2021 record closing price, and 2022 year-end close come from historical stock-price records. The intermediate correction is shown approximately; the plot combines different observation types and should not be read as a continuous daily-price chart.
Novavax’s first major rally was driven by optimism about vaccine development.
The second advance reflected continuing expectations about the company’s commercial prospects.
When market expectations changed, the valuation contracted dramatically.
The stock’s subsequent collapse illustrates a central danger of speculative markets: even a compelling investment narrative can fail to justify the prices investors are eventually willing to pay.
Novavax also offers a particularly clear visual comparison with the two-wave bubble diagram because its first major peak was already substantial before the higher second peak formed.
5. Upstart: From Early AI Optimism to a $401 Peak
Case study 4 | Upstart Holdings (UPST) | 2021–2022
Long before artificial intelligence became the dominant narrative across global equity markets, Upstart Holdings attracted investor attention through its AI-driven lending platform.
Upstart went public in December 2020.
Its shares rallied strongly during early 2021, reaching well above $100.
A significant spring correction followed.
But the stock then entered another powerful upward phase, ultimately reaching an intraday high of $401.49 in October 2021.
By the end of 2022, the stock had closed at just $13.22.
Upstart: The 2021 Boom and 2022 Collapse
Selected 2021 turning points and 2022 year-end price; USD per share

Spring prices are approximate reference levels; October 2021 is an intraday high and December 2022 is a closing price. Not a complete daily series.
The October 2021 intraday high of $401.49 and December 2022 close of $13.22 are documented in historical price records. Spring observations are approximate turning-point markers.
Upstart’s story contains many of the ingredients associated with speculative enthusiasm.
A compelling technology narrative attracted investors. Rapid appreciation encouraged increasingly optimistic expectations. A correction temporarily challenged those expectations, but a stronger rally followed.
Then changing financial conditions, rising rates, and concerns about lending demand transformed the market’s assessment of the business.
The result was a decline of more than 96% from the 2021 intraday high to the end of 2022.
Upstart is a reminder that the largest rally in a speculative cycle can occur after investors have already experienced a significant correction.
6. Four Historical Markets, One Recurring Price Structure
The shared sequence

Stylized common structure, not a plot of the four actual securities.

These four examples do not prove that a single universal bubble pattern governs every market.
Their catalysts were different.
AMC was influenced by retail trading, options activity, and short-selling dynamics.
Carvana reflected growth expectations, financing conditions, and the economics of online vehicle retailing.
Novavax was driven by vaccine-development expectations.
Upstart was influenced by enthusiasm for AI-enabled lending and later by changing credit-market conditions.
Yet their price histories share an important characteristic: a substantial correction did not necessarily prevent a higher speculative peak.
That observation brings us to silver.
Because silver may now be facing the very question that investors in these historical markets once faced:
Was the first major decline the end of the rally—or only the interruption between two larger waves?
7. Silver’s 45-Year Price Barrier: Why the 2025 Breakout Was Historic

Silver’s history makes its recent price movement especially fascinating.
In January 1980, silver reached approximately $50 an ounce during one of the most dramatic precious-metal episodes in modern financial history.
The rally ended in a spectacular collapse.
More than three decades later, in 2011, silver once again approached $50.
But it failed to establish a sustained breakout above the old nominal record.
For years afterward, the metal traded well below those historic highs.
This does not mean silver moved sideways in a narrow range for 45 years. It experienced enormous rallies and declines.
Rather, the remarkable fact is that the nominal price ceiling established in 1980 remained intact until October 2025. Then the market changed.
In 2025, silver moved above its old record, rose to roughly $72 by year-end, and accelerated into January 2026.
On January 29, the metal reached approximately $121.62 per troy ounce.
The breakout was extraordinary.
So was the subsequent collapse.

Historical milestone chart; observations are not evenly spaced. Includes historic peaks and recent spot quotations, not complete daily or annual history.
Selected observations are shown in chronological order but not proportional to elapsed time. The 1980 and 2011 peaks are historical intraday levels, while October 2026 observations come from XAG/USD daily historical data.

The decline from approximately $121.62 to $60 represents a loss of roughly half the metal’s peak value.
To an investor who purchased silver near its record high, that is a devastating correction.
To a long-term observer, however, the price is still above the nominal barrier that constrained the market for decades.
That contrast is central to the current debate.
One interpretation is that the 2025–2026 rally was a speculative blow-off that has already ended.
Another is that the breakout from a multidecade price range began a larger repricing process, with the current correction representing its first major interruption.
Neither interpretation can yet be confirmed by the chart alone.
8. Is Silver Now at the First-Correction Stage of a Minsky-Style Bubble?
This is where the historical comparisons become especially interesting.
AMC experienced an initial speculative surge, a severe correction, and then a second rally above its first high.
Carvana experienced a major correction before reaching a substantially higher valuation.
Novavax and Upstart followed similar broad sequences.
Could silver be developing a comparable structure?
Consider the sequence already observed:
Phase one: A historic breakout. Silver escaped the nominal price ceiling near $50 that had persisted for approximately 45 years.
Phase two: A rapid speculative advance. The price accelerated toward $120 in January 2026.
Phase three: A violent correction. Silver fell toward $60, losing approximately half its peak value.
The first three phases have already occurred.
The next phase is unknown.

The distinction between observed history and hypothetical future prices is essential.
Silver has not yet confirmed a second major upward wave.
The January high has not been surpassed.
And the current correction could still develop into a longer bear market.
But the historical cases demonstrate why it would also be premature to assume that a 50% decline automatically rules out another powerful advance.
In some markets, the first major correction occurred well before the final speculative peak.
The question is whether silver’s fundamentals, investor behavior, and monetary environment could support another such advance.
9. What Could Fuel a Second, More Powerful Silver Rally?

Silver is not merely a speculative financial instrument.
It is both a precious metal and a critical industrial material.
That dual identity gives it a different set of price drivers from individual equities such as AMC or Upstart.
A persistent supply deficit
The Silver Institute’s February 2026 outlook projected that the global silver market would record a sixth consecutive annual supply deficit in 2026.
Its forecast deficit was approximately 67 million ounces, with the market continuing to rely on above-ground inventories to meet demand.
The Silver Institute
A persistent deficit does not guarantee higher prices.
However, it means that changes in investment demand can occur against a backdrop of limited physical-market flexibility.
If investors increase their holdings faster than additional supply becomes available, the resulting pressure can be substantial.
Industrial demand and the energy transition
Silver is valued for its electrical conductivity and is used in a wide range of industrial applications.
These include electronics, automotive systems, photovoltaic equipment, and infrastructure associated with advanced computing.
Growth in those industries can support long-term consumption.
But higher prices also create incentives to use less silver, substitute other materials, or increase recycling.
The World Silver Survey 2026 identifies both forces: emerging industrial demand may provide support, while price-driven substitution and reduced silver use in photovoltaic manufacturing could weaken demand growth.
The Silver Institute
The long-term supply story is therefore meaningful, but not one-sided.
Monetary conditions and the U.S. dollar
Silver also responds to monetary conditions.
A weaker dollar, declining real interest rates, or growing concerns about financial stability can encourage demand for precious metals.
Conversely, a strong dollar and elevated Treasury yields can pressure silver by increasing the opportunity cost of holding a non-yielding asset.
In early October 2026, silver was trading near $60 as dollar strength and higher yields weighed on precious metals.
A sustained change in those macroeconomic conditions could influence the next major price trend.
Investment demand and market psychology
Perhaps the most unpredictable variable is investor behavior.
During the first rally, silver broke a historic price barrier and attracted enormous attention.
The subsequent decline likely damaged confidence and reduced speculative exposure.
But if silver were to recover strongly, investors might begin to reconsider the significance of the 2025 breakout.
A move back toward $100 could revive interest.
A sustained break above the previous high near $120 could strengthen the argument that a new upward phase had begun.
If that happened alongside physical-market tightness and favorable monetary conditions, speculative momentum could amplify the advance.
This is the bullish possibility.
It remains a possibility—not an established outcome.
10. What Could Prevent a Second Rally?
Any serious analysis of silver must also consider why the bullish scenario might fail.
The decline from $120 to $60 may have been the bursting of a speculative bubble rather than the first correction within a larger cycle.
If investors have already priced in years of supply tightness and industrial growth, silver may struggle to justify its previous highs.
There are several potential obstacles.
A prolonged period of high real interest rates could discourage precious-metal investment.
A stronger U.S. dollar could create additional downward pressure.
Industrial manufacturers could continue reducing silver use in response to elevated prices.
Recycling could increase, while slowing global growth could weaken industrial demand.
And investors who purchased silver during the 2025–2026 surge might continue selling into recoveries.
The Silver Institute itself expects elevated prices to encourage substitution and recycling, potentially reducing the structural deficit over time.
Therefore, a second rally is not inevitable.
The first correction might not be finished.
Silver could fall below $60, revisit its former breakout region near $50, or spend years consolidating without recovering the January peak.
This uncertainty is precisely why the Minsky-style comparison should be treated as a scenario rather than a forecast.
11. The Critical Price Levels: $60, $100, $120—and Beyond
For investors studying the possibility of a second major advance, several price levels deserve attention.

These are reference points, not guaranteed support or resistance levels.
A recovery to $80 would not prove that a second speculative wave had begun.
Even a return to $100 would leave silver below its January high.
The more important development would be a sustained move above the previous record, accompanied by strong demand and supportive market conditions.
Only then would the argument for a second major upward wave become more convincing.
But even that would not establish the eventual peak.
12. The Second Peak Is Unknown: Three Possible Futures
The future of silver is not a single line on a chart.
There are several plausible paths.

The bullish scenario imagines a recovery above the previous record and a new period of price discovery.
The consolidation scenario imagines a market that remains volatile but does not sustain a major breakout.
The bearish scenario imagines that the historic peak near $120 was the final high of the cycle.
All three remain possible.
And even if the bullish scenario begins to unfold, the ultimate price cannot be calculated from the Minsky bubble diagram.
That is the most important distinction between a useful historical analogy and an unreliable prediction.
13. Conclusion: What If the Biggest Silver Rally Has Not Happened Yet?
For approximately 45 years, silver struggled to move beyond its historic nominal highs near $50.
Then, in 2025, the barrier finally broke.
The market accelerated toward $120 in January 2026, only to collapse toward $60.
To many investors, the message is straightforward.
The bubble has burst.
The rally is over.
But financial history offers a more complicated perspective.
AMC experienced a devastating first correction before a much larger speculative rally.
Carvana suffered major drawdowns before reaching a far higher peak.
Novavax and Upstart also experienced significant intermediate corrections before their final speculative advances.
These episodes do not prove that silver will follow the same path.
But they demonstrate that the first major collapse in an asset’s price does not always mark the end of its upward cycle.
What if silver’s rally to $120 was only the first wave?
What if the decline toward $60 represents the first major correction—a period when investors lose confidence, speculative positions are liquidated, and the market appears to have exhausted its potential?
And what if the second wave, should it emerge, eventually becomes far larger than the first?
There is no guarantee that this will happen.
Silver could remain depressed for years. It could fall further. The January 2026 peak could ultimately prove to have been the highest price of the entire cycle.
But the opposite possibility cannot be dismissed simply because the market has already fallen 50%.
The Minsky-inspired bubble pattern offers no fixed timetable, no reliable price target, and no predetermined final peak.
That leaves us with one extraordinary question.
Could silver reach $500 an ounce?
Could it reach $1,000?
Nobody knows.
Those figures are not forecasts. They are not promises. And they should not be interpreted as evidence that such prices are likely.
They illustrate a fundamental truth about speculative markets:
If a second major rally develops, its ultimate peak cannot be known in advance.
It could be modest.
It could be extraordinary.
Or it might never happen at all.
The first major rally is already part of history.
The first major correction is already part of history.
The second rally remains unwritten.
And if it ever comes, no one can say with certainty how high silver might ultimately rise.
답글 남기기